
Create a budget and track your business performance
Creating a budget for your business involves a forecast of your revenues, cost of goods sold (also referred to as direct costs), operating expenses, non-operating obligations (such as interest expenses) and balance sheet items (such as capital expenditures and inventory). The budget is a blueprint for your business and you need software that provides the flexibility and ease of use to create one that is best suited and can be tracked with integration to your accounting software.
Revenues, Costs, and Operating Expenses
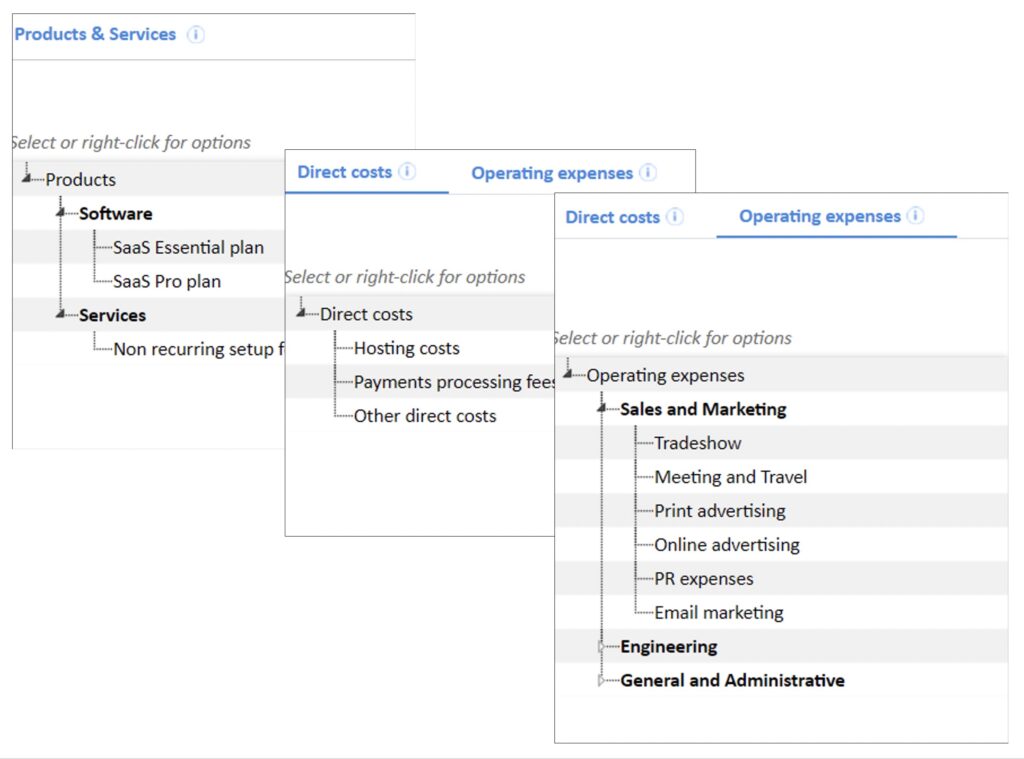
Add products and services for your revenue forecast. The list can include revenue sources that are recurring (such as SaaS) and non-recurring (such as manufactured products), as applicable for your business.
Include costs and expense line items that you want to forecast. Your model can be as detailed as you’d like. Some users add all items from their accounting chart and others forecast a subset so the list is easier to manage. For a new model, you can import a template that includes the most common items for your industry.
Organize revenues, costs, and operating expenses in departments or other categories. Hardware and Software may be product groups under which you add products, for example. Use functional groups – like sales, marketing, and G&A – for expenses. Categorization is optional and fully customizable. Reports will also include any categories that you add.
TIP: Add, edit, delete revenue and cost items through forms – no manual spreadsheet update needed
CapEx, Inventory, Debt, and Equity
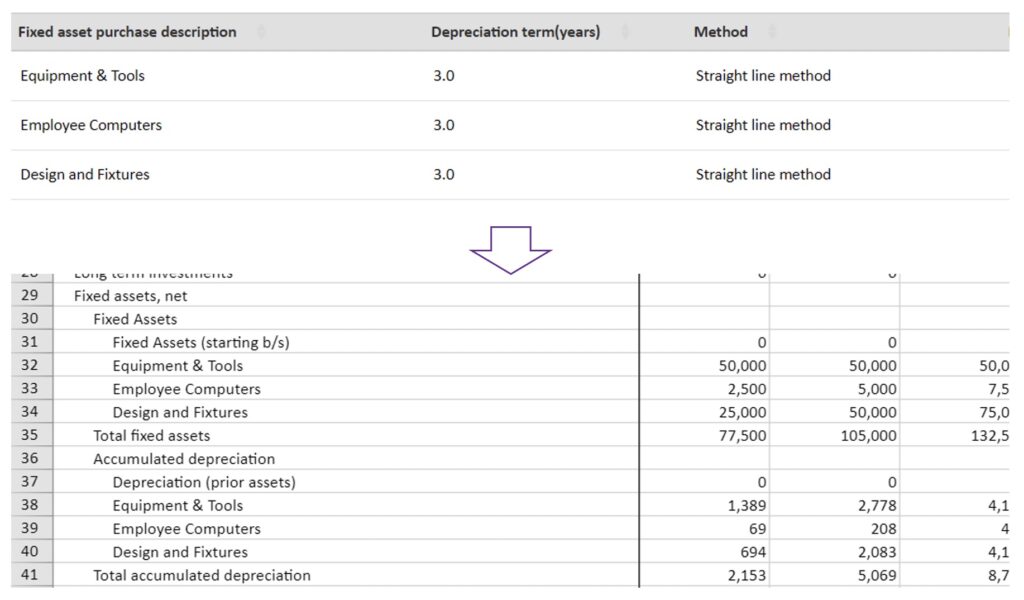
Your business may include inventory, capital expenditure (also referred to as fixed asset purchases), and various forms of financing (including equity, debt, and line of credit). Add any of these, if they apply, and, change your assumptions anytime.
Costs and other calculations associated with these assumptions are automatic and reflected in your financial projections. This includes: interest expense and principal repayments based on borrowing terms; depreciation expense based on asset life and the depreciation method you select; cost of inventory purchases and application toward cost of goods sold (to avoid double counting); and, use balance available in a line of credit to meet expenses and paydown if specified.
TIP: Add capital expenditures, inventory, and capital to see how they impact cash flow
Track Actual to Budget
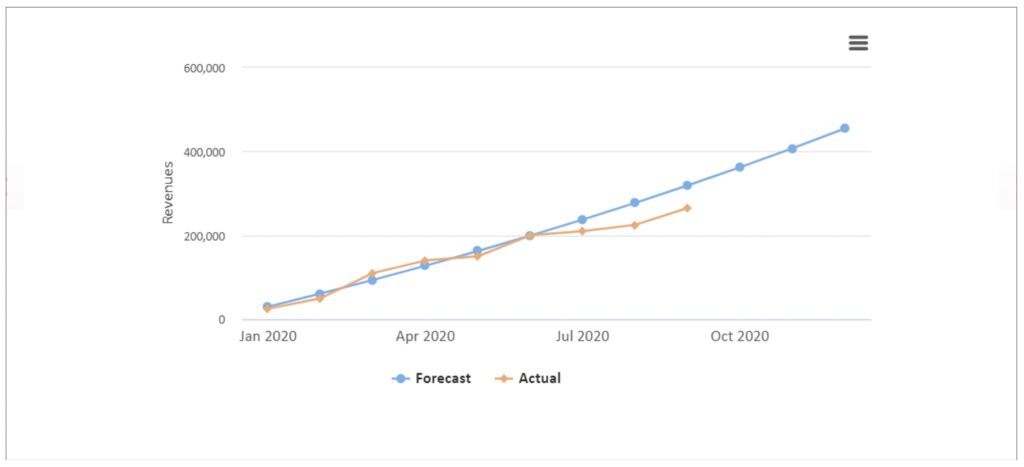
Compare actual financial results with projections to track your business. Are revenues meeting or exceeding expectations? Are costs in line and where should you focus if they are not? Are your receivables consistent with plan or extending beyond? Is cash burn at a level that is manageable? You’ll have greater insights on these and other questions with forecast to actual monitoring.
Connect your Quickbooks Online account to import data by month. View a full P&L and balance sheet comparison, or only selected items. A month by month variance report shows forecast to actual with the difference. If you have more than one scenario, select the forecast against which to compare actuals.
Review a rolling forecast that includes actual data for available periods and projections for future periods.
TIP: Forecast to Actual and Rolling forecast reports show how your results track to plan
